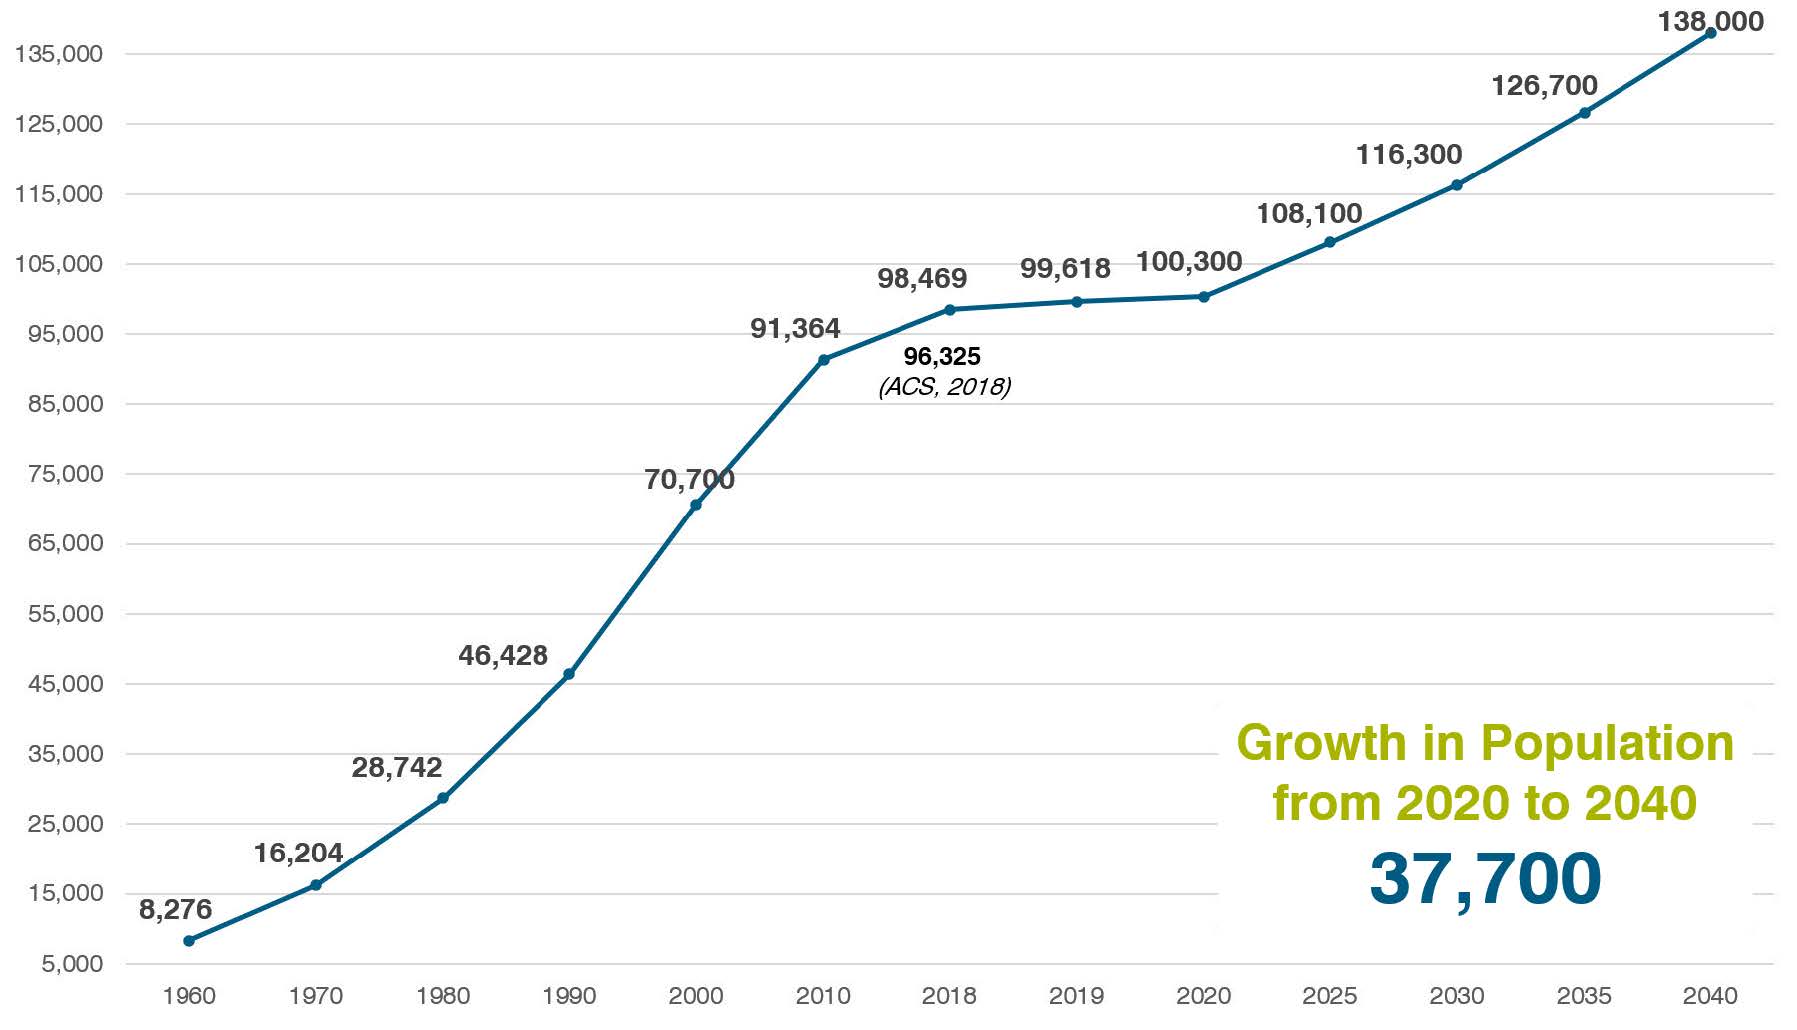
Historical data and projections from Mid-America Regional Council and the State of Missouri were used to develop the population growth expected. This growth is a target set to measure the implementation of the Comprehensive Plan. More growth or less growth than the target population over the next 20 years means the City will need to adjust the Comprehensive Plan to accommodate the actual population change.
Families with school-aged children will continue to locate in Lee’s Summit but the largest increase by population group is 65 and over. Those under 18 years of age will remain the largest population group with 32,800 people projected by 2040 (a 32% increase). Age 65+ will increase from 14,800 currently to 28,100 projected (a 90% increase). These numbers reflect the large generation, the Baby Boomers, aging into the 65 years and older category.
As the Baby Boomer generation grows, so will housing needs for this population. Many aging adults are seeking aging-in-place opportunities where they can remain in their community and close to family, friends, and activities. To age in place, older community members will need affordable, low to minimal maintenance homes and access to necessities such as healthcare services and groceries. This will require walkable neighborhoods and options for alternative transportation as senior residents age out of driving or owning personal vehicles.

Housing Market Demand in Lee’s Summit Will Continue to be Strong
As a City of 100,300 residents (2020 population estimate), Lee’s Summit has added nearly 30,000 residents since 2000. There are 41,825 housing units with a housing vacancy rate of five percent (identical to 2010 statistics). The housing market in Lee’s Summit will continue to be strong in Lee’s Summit due to the quality of housing, good schools and quality public services. Families will continue to be drawn to Lee’s Summit.
By 2040, Housing Units by 17,455 (45%)
Fewer People Per Household Will Live in New Units Built
Dramatic growth projected in 65+ age group, changing home preferences, and the cost of housing will drive down the number of people per household in the future. This reflects a growing national trend - in recent decades, most regions of the U.S. have reported decreases in household size. Generational numbers and preferences will drive housing 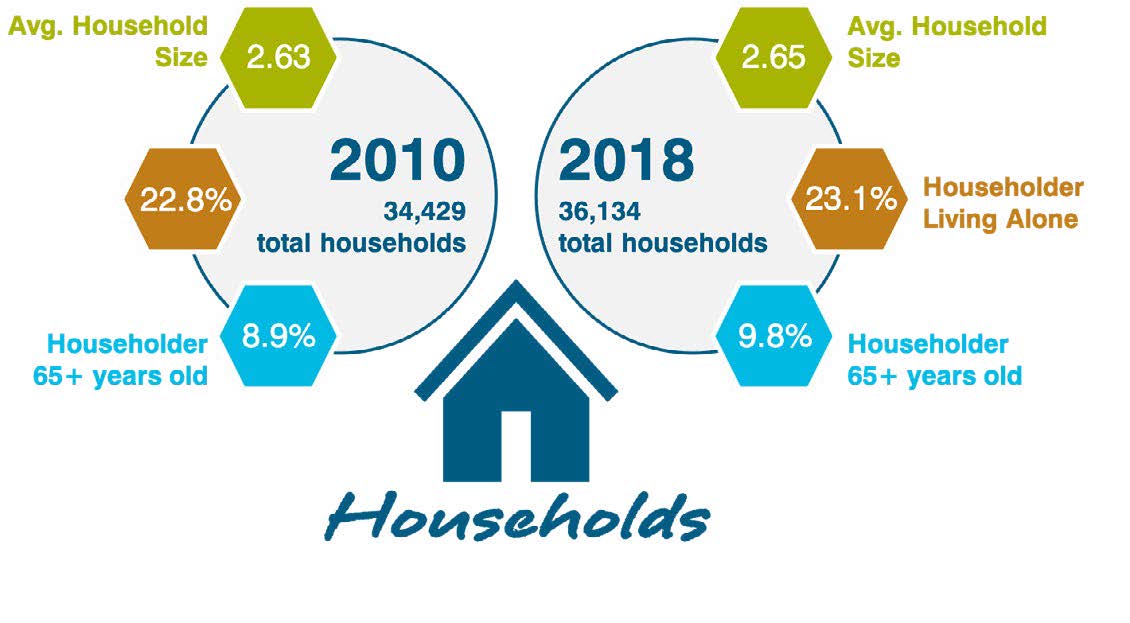 market demand. The number of people per household will decline because more people will be single and married without children. Nationally, 80% of net new households in the next 20 years will be singles and couples without children under 18. In the near term, 69% of net new households in the next 8 years will be singles and married couples without children under 18. In our region, the number of people per household has declined over the past 10 years. This trend will continue and is projected to be down from 2.76 to 1.73 people per housing. This means that while the population will grow at a similar rate than the last 20 years, the number of households needed will be more because the number of people per household will decline overall from 2.67 to 2.46. Currently, Lee’s Summit’s people per household is 2.40. In 2040, it is projected to be 2.33 people per household. New housing being built in the next 10 to 20 years will average 1.73 people per household. Smaller households mean Lee’s Summit needs more Missing Middle housing as well as medium to large lot single-family detached homes and apartments.
|
Population Per Housing Unit
|
2018 Average Household Size
|
2018 Household Living Alone
|
2018 Household 65+
|
2020
|
2025
|
2030
|
2035
|
2040
|
Total Change 2020-2040
|
|
Kansas City MSA
|
2.53
|
29%
|
10%
|
2.56
|
2.54
|
2.52
|
2.51
|
2.50
|
(0.06)
|
|
Total City - Lee's Summit, Mo.
|
2.65
|
23%
|
10%
|
2.40
|
2.32
|
2.28
|
2.22
|
2.33
|
(0.07)
|
|
Population Per Additional Housing Unit Added
|
|
|
|
|
2.32
|
1.80
|
1.73
|
1.73
|
|
Housing Affordability 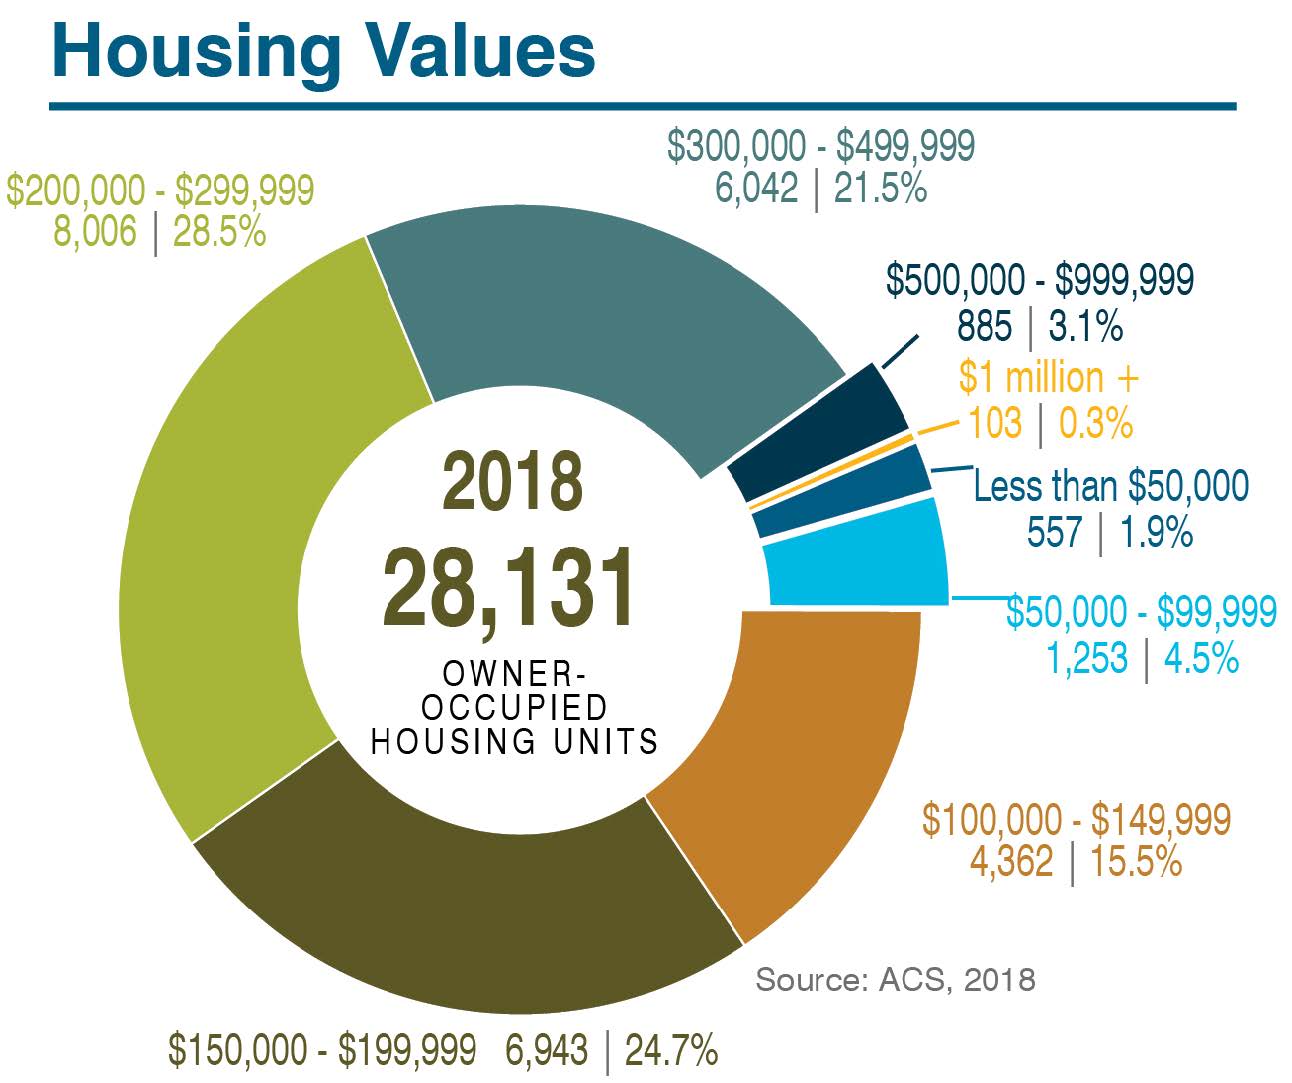
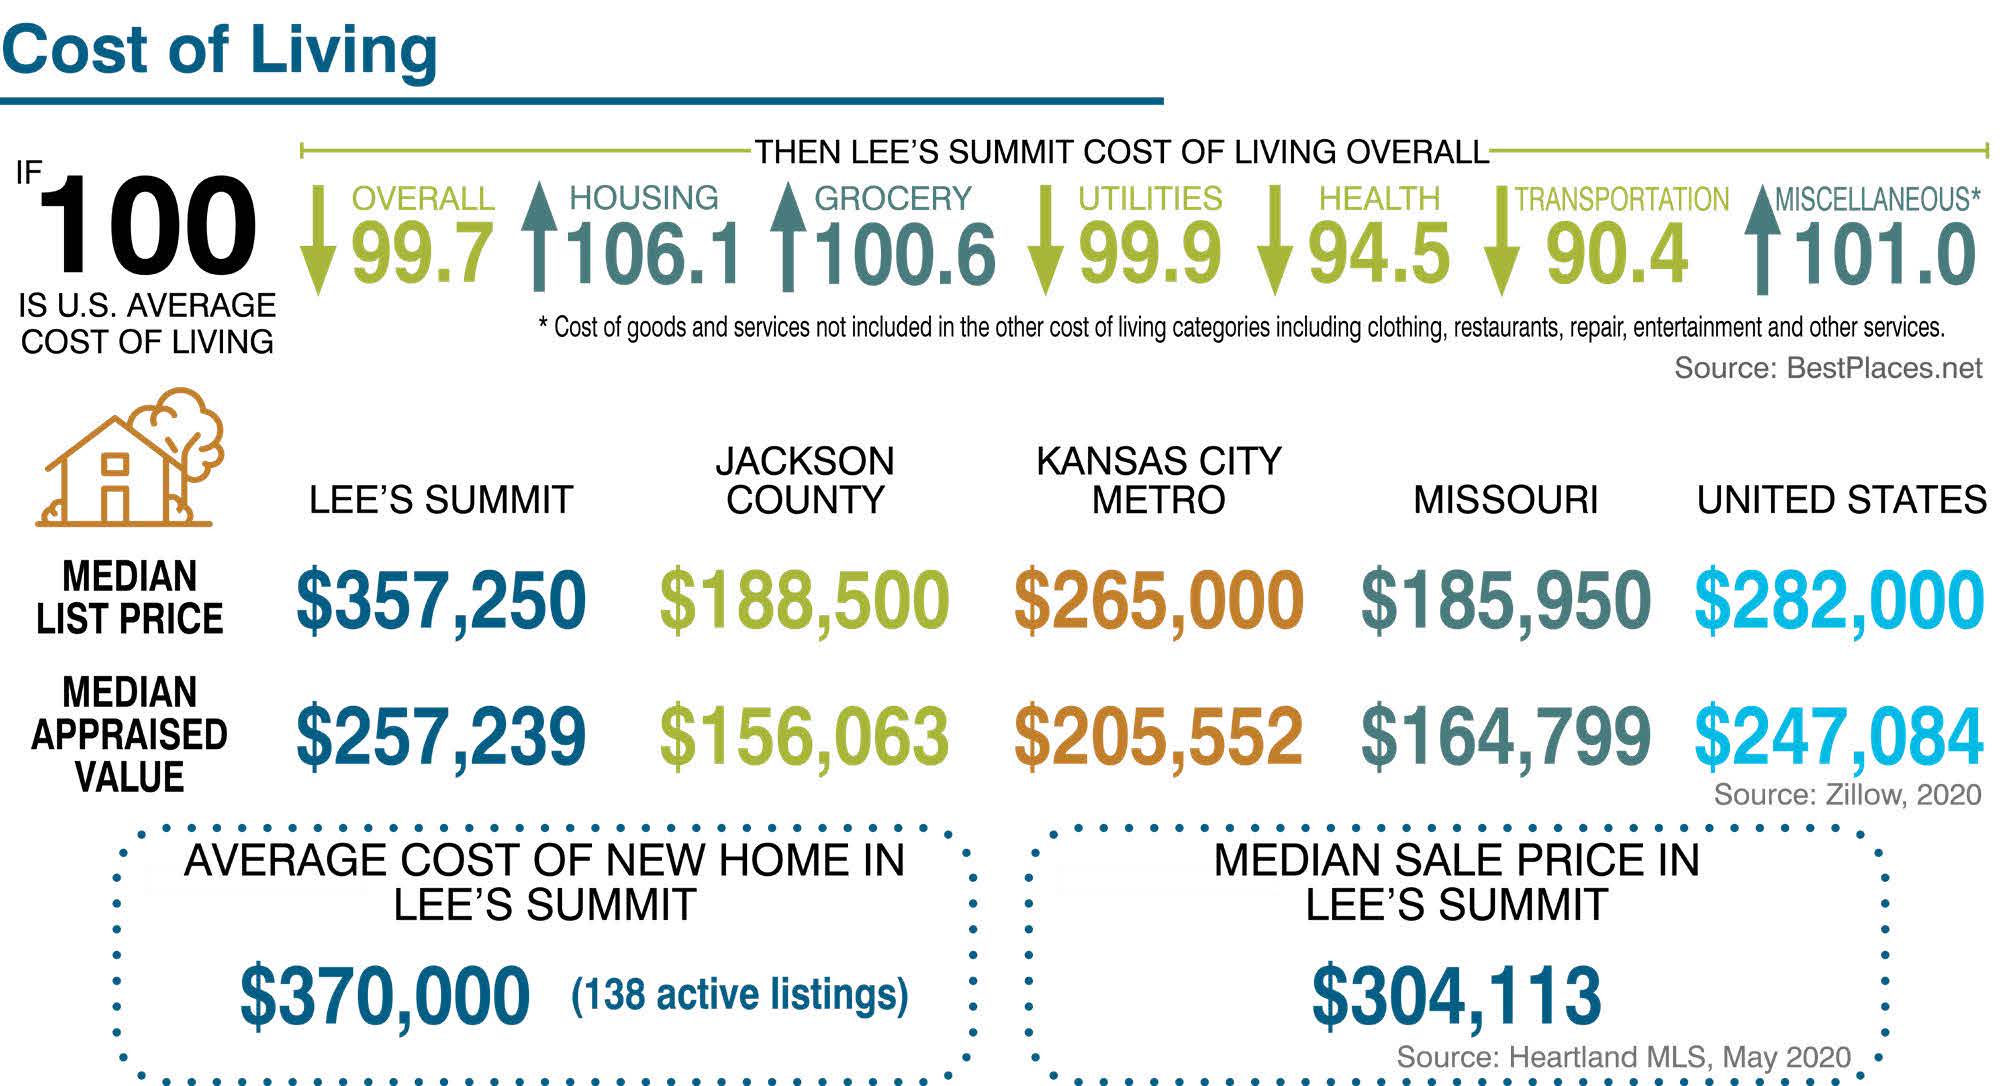
Nationally, housing affordability impacts a growing number of people. Wage stagnation and increasing cost of living means more people are spending 30 percent or more of their incomes on housing and 15 percent or more on transportation. The cost of living in Lee’s Summit closely compares to the national average with housing being slightly higher.
Median housing value over the past years has grown from $185,500 to $210,400 from 2010 to 2018. Since 2018, prices have continued to climb.
About 47 percent of people in Lee’s Summit are housing cost-burdened which means they spend 30 percent or more of their incomes on housing. Notably, median housing values are 21 percent higher, on average, than in the greater metropolitan area. Fifty percent of Lee’s Summit homes recently sold for more than $300,000. The average cost of a new home in Lee’s Summit is approximately $370,000.
Almost 25 percent of the housing stock would be considered as more affordable housing units for most families. These range from $150,000 to $199,000. Wellkept houses at this price point are rarely on the market and go quickly when they are listed. Most housing is valued in the $200,000 to $299,999 range.
The amount of housing units valued at $50,000 to $199,999 declined from 2010 to 2018. Many of these units were torn down due to the condition of the property. Homes in the $200,000 to $999,999 grew with the $300,000 to $499,999 growing the most at 73%. The number of $1,000,000+ homes doubled. Lee’s Summit prepared a housing assessment in 2017 to identify housing needs.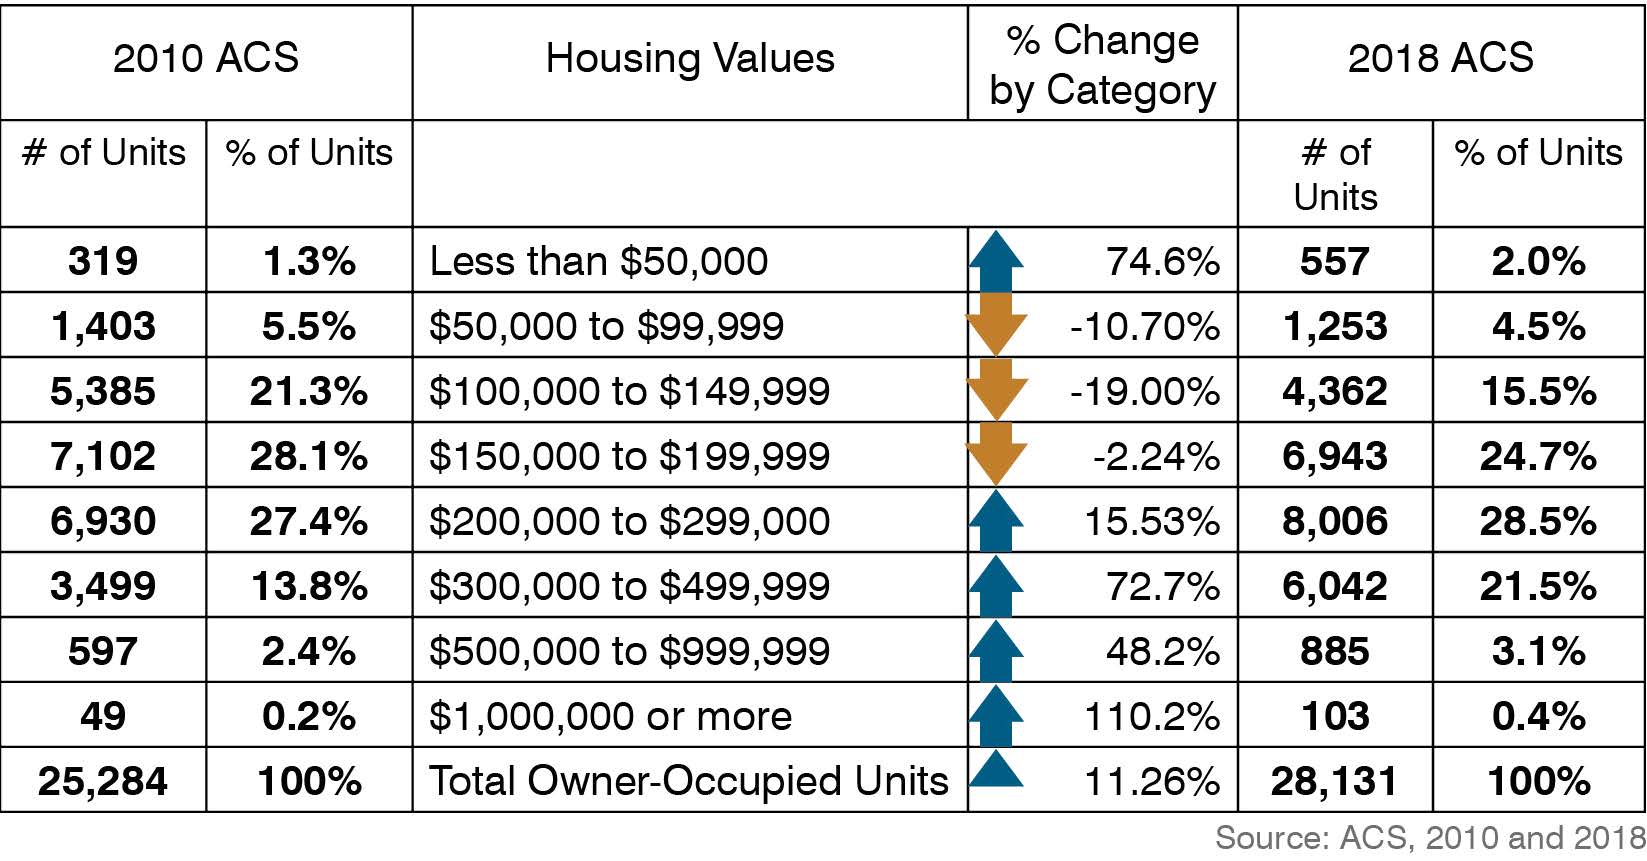
View 2017 Housing Assessment
Attainable Housing vs. Affordable Housing
Attainable housing refers to market-rate housing for sale that is unsubsidized, profitable and meets the needs of those with incomes between 80% and 120% of the Area Median Income. The price points for attainable housing vary by metro area depending on the Area Median Income, with FHA Loan Limits typically hovering around 115% of Area Median Income. Attainable housing is not the same as affordable housing or subsidized housing. Attainable Housing is sometimes called workforce housing because it is important to have teachers, firefighters, police officers and others who make up the workforce living in the community. The chart below describes what is considered attainable in Lee’s Summit. While this may not seem affordable to many, this is seen by most banks as attainable. The amount that is considered affordable is also listed for the same income levels for comparison. While the goal is to keep housing costs at 30% of Median Household Income, the “H+T Index” or cost of housing and transportation should not go above 45% of income. Anything more is a cost burden.
United States Department of Housing and Urban Development (HUD) defines affordability as paying no more than 30% of median household income for housing. This affordability standard is not an underwriting standard, and it does not say that households are unable to pay more than that amount, but it is a useful rule-of-thumb. Households may choose to pay more to get the housing they need or want but, according to HUD standards, they should have access to decent, safe housing for no more than 30% of their household income. Many Lee’s Summit upper-income level households spend more than 30% of their income on their homes. The average household spends $13,334 per year or $1,111 per month on transportation.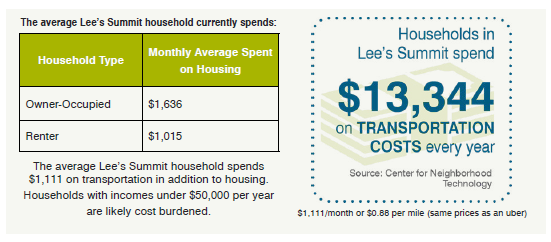
To learn whether there is an adequate supply of affordable housing, the number of households within the various income categories must first be determined:
|
Income and Benefits (In 2018 Inflation-Adjusted Dollars)
|
Income & Benefits
|
Number of Households
|
Percent of Total Households
|
Affordable Monthly Housing Costs 30% of Household Income
|
Affordable Monthly Transportation Costs 15% of Household Income
|
Total Affordable Monthly Housing + Transportation Costs by Income 45% of Household Income
|
|
Lee's Summit, MO
|
|
36,134
|
36,134
|
|
|
|
| AFFORDABLE HOUSING + TRANSPORTATION EXPENDITURE BY INCOME LEVEL |
|
Less than $10,000
|
$10,000
|
872
|
2.40%
|
$250
|
$125
|
$375
|
|
$10,000 to $14,999
|
$15,000
|
1,083
|
3.00%
|
$375
|
$188
|
$563
|
|
$15,000 to $24,999
|
$25,000
|
2,113
|
5.80%
|
$625
|
$313
|
$938
|
|
$25,000 to $34,999
|
$35,000
|
1,760
|
4.90%
|
$875
|
$438
|
$1,313
|
|
$35,000 to $49,999
|
$50,000
|
3,514
|
9.70%
|
$1,250
|
$625
|
$1,875
|
|
$50,000 to $74,999
|
$75,000
|
6,142
|
0%
|
$1,875
|
$938
|
$2,813
|
|
$75,000 to $99,999
|
$100,000
|
5,955
|
16.50%
|
$2,500
|
$1,250
|
$3,750
|
|
$100,000 to $149,999
|
$150,00
|
7,567
|
20.90%
|
$3,750
|
$1,875
|
$5,625
|
|
$150,000 to $199,999
|
$200,000
|
3,563
|
9.90%
|
$5,000
|
$2,500
|
$7,500
|
|
$200,000 or more
|
|
3,565
|
9.90%
|
|
|
|
|
Area Median Household Income (dollars)
|
$85,325
|
|
(X)
|
$2,133
|
$1,067
|
$3,200
|
|
Mean Household Income (dollars)
|
$85,325
|
|
(X)
|
$2,596
|
$1,298
|
$3,894
|
| ATTAINABLE HOUSING & TRANSPORTATION TARGET - housing that meets the needs of those with incomes between 80% and 120% of the Area Median Income |
|
80% of Area Median Income (dollars)
|
$66,260
|
|
(X)
|
$1,707
|
$853
|
$2,560
|
|
120% of Area Median Income (dollars)
|
$102,390
|
|
(X)
|
$2,560
|
$1,280
|
$3,840
|
Subsidized & Special-Needs Housing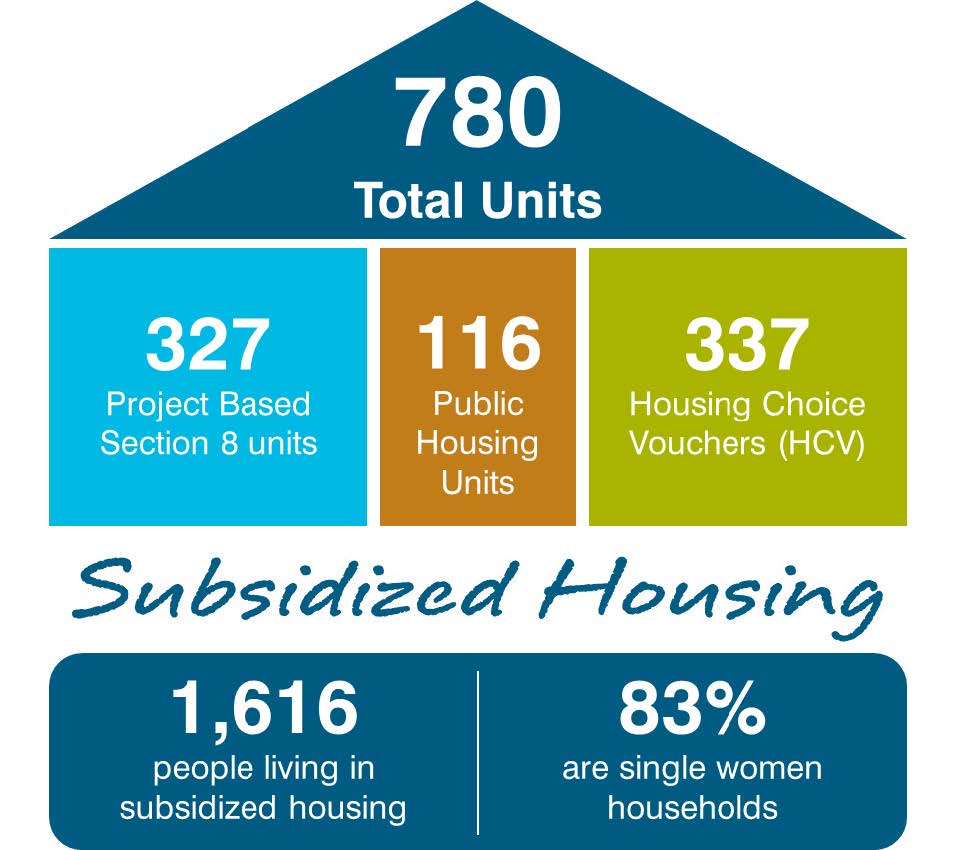
Subsidized housing is subsidized by the federal government or built with federal assistance and owned by the local housing authority or private entities. In other cases, the subsidy is distributed to the household that pays the rent for a privately owned unit. In Lee’s Summit, 15 percent of the rental stock is subsidized. The largest share of the assisted units are in low-income housing tax credit (LIHTC) developments, with 500 units in five developments subsidized through this program. Property available below 100% Average Median Income as shown in the table above could potentially qualify for federal housing subsidy. The U.S. Department of Housing and Urban Development (HUD) for Consolidated Plans also looks at the median income for a community and determines how many units are available to various low- and moderate-income households.
Many federal and state housing funding programs are tied to the 30%, 50% and 80% of the median income for households of different sizes.
|
Subsidized Housing Thresholds (2018 American Community Survey Data)
|
Income Level
|
|
Area Median Income (dollars)
|
$85,600
|
|
Extremely low-income households are those with incomes below 30% of the area median household income.
|
$25,598
|
|
Very low-income households with an income between 30% and 50% of the area median household income.
|
$42,663
|
|
Low-income households are those with incomes between 50% and 80% of the area median household income.
|
$68,260
|
|
Moderate-income households have incomes between 80% and 95% of the area median household income.
|
$81,059
|
About 10% of the population is considered extremely low-income with 15% each of the other categories. Approximately 45% of the households are considered high-income when compared to the Area Median Income.
Owner Occupied and Rental Units
About 75 percent of all homes are owner-occupied so there is very little opportunity to move to Lee’s Summit without the wealth to own a home. Vacancy rates tells a great deal about the health of a housing market. If the vacancy rates are too low, the market is not providing enough housing. If the vacancy rates are too high, the market is providing more than is needed. In a healthy market, the rental vacancy rate is usually between 5.0 and 7.0 percent. In the market for owner-occupied housing, the vacancy rate is usually between 1.75 and 2.0 percent. Increasing demand, low vacancy rates and low supply means increasing costs to purchase and to rent.
Preserving Quality of Existing Homes
Most of the housing was constructed between 1980 to 2010. Most houses built pre-1980 (10,335 – 27%) generally have a smaller footprint and therefore may be more affordable to purchase and maintain.
But as homes age, the cost to maintain it increases. Housing needs system upgrades over time along with day-to-day maintenance. Updates to electrical, plumbing, HVAC, roofing, siding, etc. can be costly Incentives such as home repair programs ease the cost burdens of upgrading homes.
Continued infrastructure investment and improved connectivity to amenities and services can maintain the desirability and attractiveness of older neighborhoods.
Public infrastructure investments in neighborhoods can also encourage property owners to make improvements.
Preservation of housing stock is important to conserve the character of neighborhoods and the history of a city. Housing is often a reflection of its time—architecture, function, size—so it connects future generations to the past. Housing can become obsolete, but most can be adapted for today’s needs. Some homes are remodeled to meet current needs while others are torn down and new homes built in their place. Preserving existing housing is more cost-effective and easier than new construction. Rehabilitating an existing affordable apartment can cost one-third to one-half less than building a new apartment.
Thinking Outside of the Housing Box
Re-purposing obsolete commercial strip centers in the city is another approach to provide attainable, charming neighborhoods. Repurposing obsolete strip center locations for added housing can effectively accommodate townhome-type developments adjacent to corridors.
Well-served by utilities and transportation these locations may have outlived most of their commercial functions and can accommodate residential and mixed-use developments more cost-effectively undeveloped property.
Communities for All Ages
Many people want to live in a community throughout their lifespan. Different housing is needed at different stages of life.
Lee’s Summit offers quality senior housing facilities. Senior housing that offers a maintenance-free lifestyle and varying levels of care are not affordable to everyone. Some seniors would like to live in their home and community safely, independently, and comfortably, regardless of age, income, or ability. The American Planning Association refers to the concept as “aging in community,” where “older adults can live as independently as possible in the community of their choice.”
The City of Lee’s Summit is an aging-friendly community with awareness, implementation and strategies that address changing demographics. Lee’s Summit is recognized for its Community for All Ages Plan with Gold and Silver certifications.
Universal Design
Neighborhoods and housing that work for people with disabilities, older people and everyone is called universal design. As the population ages, market demand for universal design in housing and entire neighborhoods will grow.
Multi-generational Housing
Demand for multigenerational housing is increasing. We are seeing more people building on to their existing home or accessory unit places for their parents or adult children to live. As our community becomes more diverse, many immigrant cultures prefer multiple generations living under one roof.
Co-housing
Roommates are not just for people in their 20’s. Seniors are turning to cohousing to cut costs and loneliness. Cohousing is a community designed to foster connection. Physical spaces allow neighbors to easily interact with others just outside private homes. Common areas including the kitchen, dining space and gardens bring people together. Collaborative decision-making builds relationships.
Accessory Dwelling Units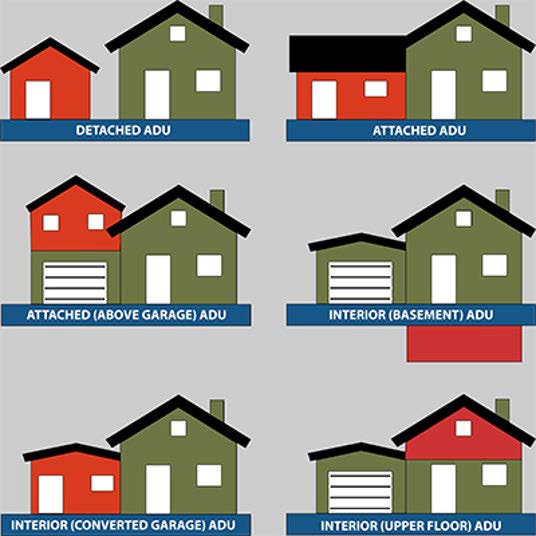
An accessory dwelling unit (ADU) is a smaller, independent residential dwelling unit located on the same lot as a stand-alone (i.e., detached) single-family home. ADUs go by many different names throughout the U.S., including accessory apartments, secondary suites and granny flats. ADUs can be converted portions of existing homes (i.e., internal ADUs), additions to new or existing homes (i.e., attached ADUs), or new stand-alone accessory structures or converted portions of existing stand-alone accessory structures (i.e., detached ADUs).
Internal, attached and detached ADUs all have the potential to increase housing affordability (both for homeowners and tenants), create a wider range of housing options within the community, enable seniors to stay near family as they age, and facilitate better use of the existing housing fabric in established neighborhoods. Homes associations can prohibit, but the City will allow in all Residential Category 1.
Impact of Technology on Housing
Technological advances will improve the quality and efficiency of homes. Smart homes equipped with several devices that automate tasks normally handled by humans are becoming the norm. Lighting, climate, entertainment systems, appliances and security systems can already be run from a phone app. In the future, energy and resource-efficient homes will be designed to keep utility costs reasonable. Technological advances in building materials and construction practices will improve the quality and efficiency at a more attainable cost.
Changing Housing Market
Charming, friendly, inclusive and welcoming communities generally offer a variety of housing products with varying types and price points. Ideally, sidewalks, trails and open spaces connect homes within neighborhoods to the broader community.
Lee’s Summit will continue to be known for the finest quality single-family neighborhoods well into 2040. The current and projected largest land use is single-family detached housing on medium and large lots.
Nationally and regionally, the suburban housing market is changing. The number of people per household will decline. Some baby boomers, Millennials (Gen Y), and Gen Z’s American Dream are very different than their parents. Most Millennials will not own homes due to affordability issues but also preference. With a median income in the US of $33,883, Millennials are encountering an average rental price of $925 per month. This price point puts many homes outside the reach of Millennials and Gen Z. Smaller single-family homes on smaller lots are generally more affordable and less to maintain. As people age, many are looking for homes with a master on the first floor and smaller yards so they can stay in their homes.
Kansas City’s suburbs fueled population growth in the metro over the last 70 years. This growth will continue over the next 20 years and Millennials will drive that growth. Many high-income Millennials are choosing to live in the suburbs -- 84% of high-income Millennials in the Kansas City region live in the suburbs. Millennials and Baby Boomers are drawn to suburbs that are becoming denser taking on certain characteristics that seem urban-like. They are more diverse, have more mixed land use and more people commute to them as they become job centers. This is a gradual process that will change the perception we have of the suburbs. People of all generations are seeking homes connected to vibrant activity centers with walkable areas where everyday needs are nearby. People used to move where the jobs are located. Now and into the future, jobs will move to where people want to live.
Neighborhoods designed with smaller lots and smaller homes with more extensive shared indoor and outdoor common areas are growing in demand. Maintenance-provided housing is growing in demand that accommodates young professionals and empty-nesters who want to lock up and leave to travel periodically. This type of housing appeals to young and old who do not want to personally maintain a property. Housing developers in Lee’s Summit are already providing these types of homes. This trend will continue.
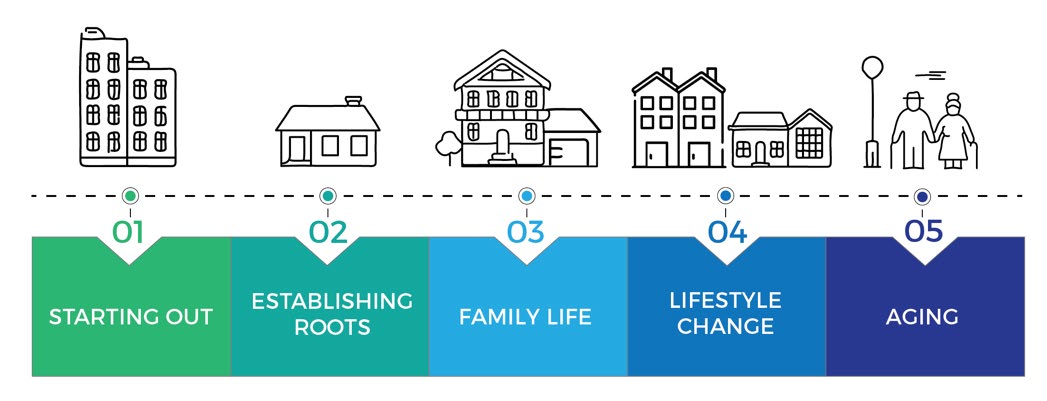
Housing for All
Housing demand is most often spurred by a change in lifestyle such as marriage, divorce, change in employment, birth of a child, children moving out, or retirement, any of which can result in a choice to simplify life with low-maintenance living and greater disposable income. The types of housing needed in a community to allow people to live there regardless of age or lifestyle include housing for people starting out, those establishing roots, families, those looking for a lifestyle change and those aging. It is important that a variety of housing be available at different price points and for different stages of life.
Housing types are broken into three categories based upon intensity for purposes of planning. Rather than focus on whether the housing product is single-family, multi-family, detached or attached, residential categories are based upon the intensity of each use. Intensity is described as how different uses relate to each other. Whether it be building scale, the amount of traffic generated, or operational impacts, types of residential development are grouped by the intensity of use.
|
Category 1 - Lower Intensity
|
- Traditional medium and large lot single-family detached housing (8,500+ square foot lots)
|
Category 2 - Medium intensity - sometimes called Missing Middle Housing
|
- Small lot single-family detached housing (4,000 – 7,499 square foot lots)
- Duplex side-by-side or stacked
- Fourplex stacked
- Courtyard building
- Cottage court
- Townhome
- Multiplex Medium
- Triplex-Stacked
- Live-Work
|
Category 3 - Higher intensity
|
- Midrise Mixed-Use
- Apartment Complexes
Fill the Missing Middle Housing Gap
Housing of all types are needed to meet future demand. The largest gap to fill is missing middle housing.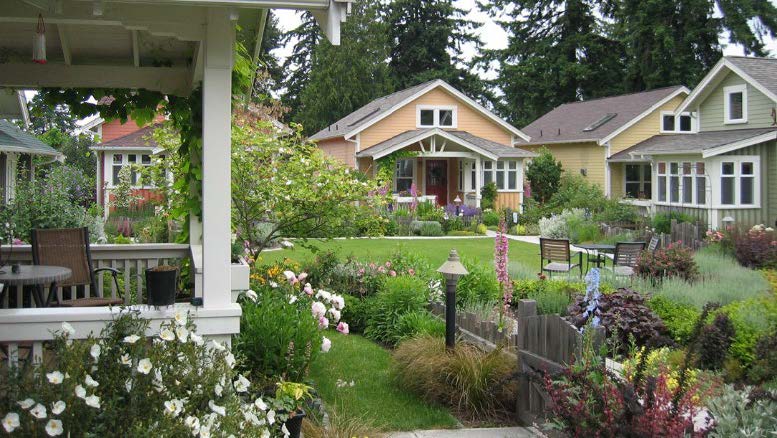 Missing middle housing fills the gap between traditional detached single-family housing and larger multi-unit apartment buildings. Missing middle building types, such as duplexes, fourplexes, cottage courts, courtyard buildings, and townhomes provide diverse housing options and support locally serving retail and public transportation options. Missing middle housing is the same scale as the typical single-family home in Lee’s Summit but has multiple units in walkable neighborhoods near employment and services. Increasing the number of housing units per acre and locating them near commercial services and transportation reduces the overall cost to live in that neighborhood.
Homebuilders, initially looking to target the emerging millennial demographic through reduced footage and lower price points, have discovered that other generations are also interested in smaller homes. Singles, couples, and small families of all ages and income levels are looking to maximize their disposable income and minimize their home maintenance commitment, hoping to prioritize experience and free time over possessions and a large home. The market for single-family detached homes is strong regardless of income level or age of occupants. The cost of land and construction materials for a traditional size Lee’s Summit home can be prohibitive for many income groups. Smaller homes are not just becoming a necessity for affordability but are increasing in demand due to changes in personal preferences and lifestyles. Many builders define a home as “small” if it is less than 1,800 square feet. But those on the leading edge of this category are pushing the definition of a small home to less than 1,400 square feet. Detached cluster homes allow higher density than traditional single-family homes but create the traditional feel that many home-buyers are looking for. The design of pocket neighborhood, green cottage court, and alley-loaded configurations yield densities with smaller house footprints are desirable, especially if there is maintenance provided.
Attainable housing yields similar margins to higher-priced homes due to faster turnover and more rapid price appreciation. Attainable housing addresses pent-up demand in a segment that has limited supply, which creates greater price elasticity and more upside revenue potential than any other segment.
The current mix of housing units is 72% Category 1; 13% Category 2; and 15% Category 3. To move closer to market demand and maintain the community character and high-quality provision of public services and infrastructure an increase in Missing Middle Housing Category 2 as a percent of the total is recommended.
The following table details future housing projections based upon the recommended mix of housing types.
|
Residential Development by Type
|
Current Dwelling Units
|
Current Dwelling Units/Acre
|
% Current Dwelling Units
|
Total Future Dwelling Units
|
Total Future % Dwelling Units
|
Future Dwelling Units Per Acre
|
Change Total Dwelling Units
|
Current Residential Acres
|
Future Residentail Acres
|
|
Category 1
|
30,049
|
2.54
|
72%
|
38,532
|
65%
|
3.04
|
8,483
|
11,830
|
12,675
|
|
Category 2
|
5,562
|
8.36
|
13%
|
11,856
|
20%
|
12
|
6,294
|
665
|
988
|
|
Category 3
|
6,214
|
14.75
|
15%
|
8,892
|
15%
|
36
|
2,678
|
421
|
247
|
|
Total
|
41,825
|
|
100%
|
59,280
|
100%
|
|
17,455
|
12,917
|
13,910
|
ACRE TABLE
Housing located in close proximity to neighborhood commercial development increases the resiliency of both types of development. Activity Centers and Priority Corridors are locations where most of the new Category 2 and 3 housing units should be located. This approach follows the concept that it takes 2,000 people to be located within a 15-minute walk of one block of retail development for both to thrive.
The numbers in the table show the projected housing unit growth through 2040 both inside and outside activity centers. Most of the new units built will be inside the Activity Centers (56% or 9,800) but most of the housing new and old will be located outside of the Activity Centers (73% or 43,550) in 2040.
Lee’s Summit will not be fully built out in 2040 as more units are expected both inside and outside of the Activity Centers and Priority Corridors.
|
Projected Housing Demand
|
Existing Dwelling Units
|
New Dwelling Units
|
2040 Total Dwelling Units
|
% New Units Allocated
|
% Total Dwelling Units
|
|
Activity Centers
|
5,930
|
9,800
|
15,730
|
56%
|
27%
|
|
Outside Activity Centers
|
35,895
|
7,655
|
43,550
|
44%
|
73%
|
|
Total
|
41,825
|
17,455
|
59,280
|
|
|
The numbers in the table above only include growth projected to 2040. More housing units are expected both inside and outside of the Activity Centers to full-build out.